 FormaTerre
dataset
Type of resources
Available actions
Topics
INSPIRE themes
Keywords
Contact for the resource
Provided by
Years
Formats
Representation types
Update frequencies
status
Scale
-
The Hot Dry Rock (HDR) site of Soultz-sous-Forêts in Alsace was chosen in 1986 for scientific investigations. During the first phase of the project (1987-1988), a first borehole GPK1 (https://cdgp.u-strasbg.fr/geonetwork/srv/fre/catalog.search#/metadata/SSF-GPK1) was drilled. It reached a final depth of 2000 m and various investigations were undertaken during that period. In December 1988, an injection test was made at the bottom zone of this borehole with a relatively low flow rate of 3.3 l/s for a period of three days. Induced seismicity recorded was detected by 3-axis geophone probes deployed in three old recovered oil wells at depth ranging from 850 to 1350 m. A small amount of the detected seismicity could be located and showed a trend to grow towards greater depths than the injection zone. The following report from BRGM in the link gives details about the experiments and presents the results about the seismic monitoring and the location of the events. Some hydraulic data are presented as well with figures.
-

Catalogue with hydraulic data from the article of Drif et al.(2024) at Soultz-sous-Forets 2010. For more detailed calculations, see the article Induced Seismicity Controlled by Injected Hydraulic Energy: the Case Study of the EGS Soultz-sous-Forets Site by Drif,K., Lengline, O., Kinscher, J., Schmitbuhl, J. (2024) (http://dx.doi.org/10.1029/2023JB028190) The data parameters are the following: Column 1:Time from start: 30/11/2009 23:00:00 Column 2: Time_from_start_injection: time elapsed since start of fluid injection [hours] Column 3: Mean of the depth events (whose magnitude > Mc) occurred during each hour [m] Column 4: Cumulative injected volume in [m3] Column 5: Cumulative hydraulic energy in [J] Column 6: Cumulative seismic moment (events whose magnitude > Mc) in [N.m] Column 7: The seismic moment associated to the largest event (whose magnitude > Mc) occurred to date in [N.m] Column 8: Cumulative radiated seismic energy (events whose magnitude > Mc) in [J] Column 9: Seismic Injection Efficiency defined as the ratio between Er_cum and W_hyd_cum Column 10: Cumulative seismic faulting energy (events whose magnitude > Mc) in [J] Column 11: Seismic faulting efficiency definied as the ratio between W_fault_cum and W_hyd_cum Last update of data: 07/05/2024
-

Catalogue with hydraulic data from the article of Drif et al.(2024) at Soultz-sous-Forets 2005. For more detailed calculations, see the article Induced Seismicity Controlled by Injected Hydraulic Energy: the Case Study of the EGS Soultz-sous-Forets Site by Drif,K., Lengline, O., Kinscher, J., Schmitbuhl, J. (2024) ( http://dx.doi.org/10.1029/2023JB028190) The data parameters are the following: Column 1: Time from start: 07/02/2005 18:00:00 Column 2: Time_from_start_injection: time elapsed since start of fluid injection [hours] Column 3: Mean of the depth events (whose magnitude > Mc) occurred during each hour [m] Column 4: Mean of flowrate during each hour [l/s] Column 5: Cumulative injected volume in [m3] Column 6: Cumulative hydraulic energy in [J] Column 7: Cumulative seismic moment (events whose magnitude > Mc) in [N.m] Column 8: The seismic moment associated to the largest event (whose magnitude > Mc) occurred to date in [N.m] Column 9: Cumulative radiated seismic energy (events whose magnitude > Mc) in [J] Column 10: Seismic Injection Efficiency defined as the ratio between Er_cum and W_hyd_cum Column 11: Cumulative seismic faulting energy (events whose magnitude > Mc) in [J] Column 12: Seismic faulting efficiency definied as the ratio between W_fault_cum and W_hyd_cum Last update of data: 07/05/2024
-
Data used to generate the figures of the paper: J. Azzola, J. Schmittbuhl, D.Zigone, V. Magnenet, and F. Masson (2017). Direct modeling of the mechanical strain influence on coda wave interferometry. Journal of Geophysical Research. Accepted article. (https://doi.org/10.1002/2017JB015162) This work has been published under the framework of the LABEX ANR-11-LABX-0050-G-EAU-THERMIE-PROFONDE and benefits from a funding from the state managed by the French National Research Agency (ANR) as part of the ‘Investments for the Future’ program. It has also been funded by the EU project DESTRESS (EU H2020 research and innovation program, grant agreement No 691728). This work is licensed under a Creative Commons Attribution 4.0 International License (http://creativecommons.org/licenses/by/4.0/)
-
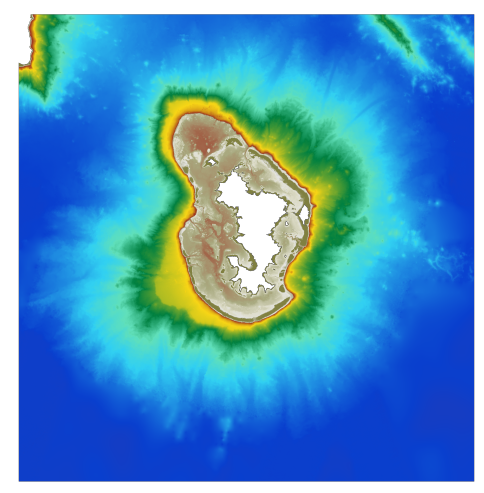
The bathymetric DEM for the coasts of Mayotte with a resolution of 0.001° (~ 100 m) was prepared as part of the HOMONIM project. It covers the entire island of Mayotte and extends to Anjouan island in the west. The model ranges off-shore to a depth of 3700 m. The DEM is designed to be used in hydrodynamic models in order to produce high-precision forecasts for coastal water levels and sea conditions and therefore improve the pertinence of the Waves-Submersion monitoring programme. This product is available with the Lowest Astronomic Tide (LAT) or the Mean Sea Level (MSL) as a vertical datum.
-
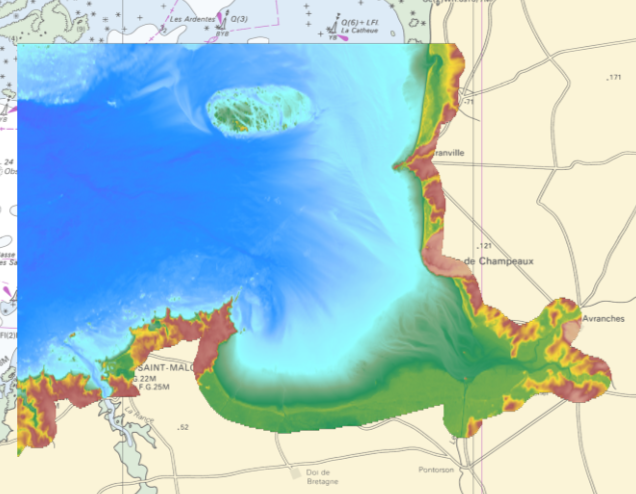
The coastal topo- bathymetric DEM of a part of the Norman-Breton gulf with a resolution of 0.0002° (~ 20 m) was prepared as part of the PAPI Saint-Malo. It covers the Minquiers plateau in the north-west to the bay of Mont-Saint-Michel in the south-east. The DEM is designed to be implemented in the hydrodynamic models of the TANDEM project in order to estimate the coastal effects of tsunamis for the Atlantic and English Channel, where French nuclear power plants have been installed for about 30 years. This product is available with the Lowest Astronomic Tide (LAT) or the Mean Sea Level (MSL) as a vertical datum.
-

Velocity model and station corrections described in the PhD thesis of <b>N. Cuenot</b>, used to calculate location of microseismic events of his first catalogue of the 2000 stimulation episode at Soultz-sous-Forêts. N. Cuenot performed preliminary locations during his PhD using a modified version of the HYPOINVERSE program (Klein, 1978). An initial velocity model established by Darnet (2000) was first used but did not give satisfactory results. The velocity model was thus refined. P waves velocities were iteratively calculated by minimizing residual errors at the stations. The ratio Vp/Vs was similarly adjusted in the sedimentary layers. At least, station corrections were used to get hypocenters as precise as possible. The first catalogue of events of the 2000 episode calculated by N. Cuenot using the HYPOINVERSE program is available (https://cdgp.u-strasbg.fr/geonetwork/srv/fre/catalog.search#/metadata/SSFS2000-catalogue). Last update of data: 26/11/2018
-
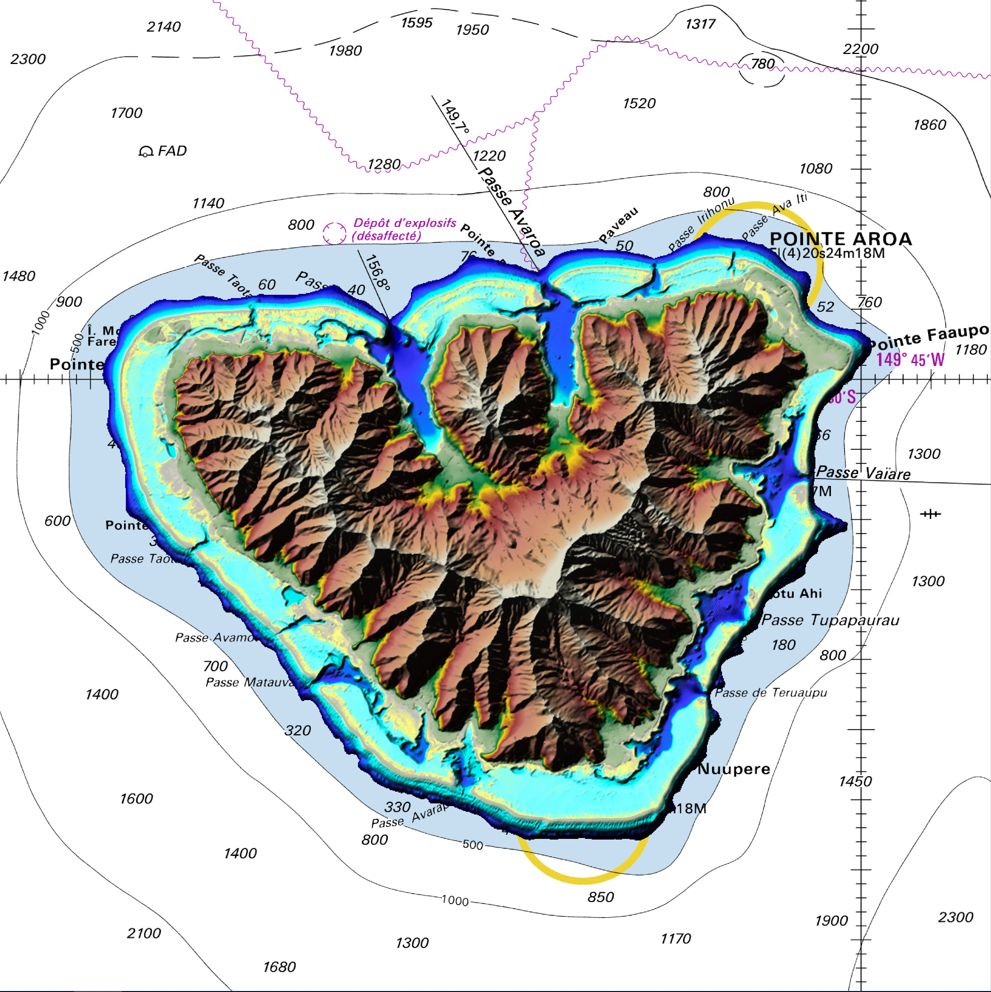
The coastal topo-bathymetric DEM of Moorea with a resolution of 0.0002° (~ 20 m) was produced by the Shom for Météo-France (Inter-regional Direction in French Polynesia). This DEM covers the Moorea lagoons down to the 100 m isobath, in order to meet the need for modeling marine submersions in French Polynesia. It complements the bathymetric DEM of Tahiti and Moorea, with a resolution of 0.001° (~ 100 m). This product is available at different vertical references, either the lowest astronomical tide (LAT) or the mean sea level (MSL).
-

The update of the coastal topo-bathymetric DEM of the Gironde estuary - downstream with a resolution of 0.0002° (~ 20 m) was carried out in the third phase of the HOMONIM project. This DEM covers the downstream part of the Gironde estuary, from Pauillac to its mouth. It is complementary to the DEM covering the upstream estuary. The DEM is intended to be implemented in hydrodynamic models in order to produce forecasts as accurate as possible of water heights and sea states at the coast to improve the relevance of the Wave-Submergence Vigilance. This product is available with either the Lowest Astronomic Tide (LAT) or the Mean Sea Level (MSL) as a vertical reference.
-
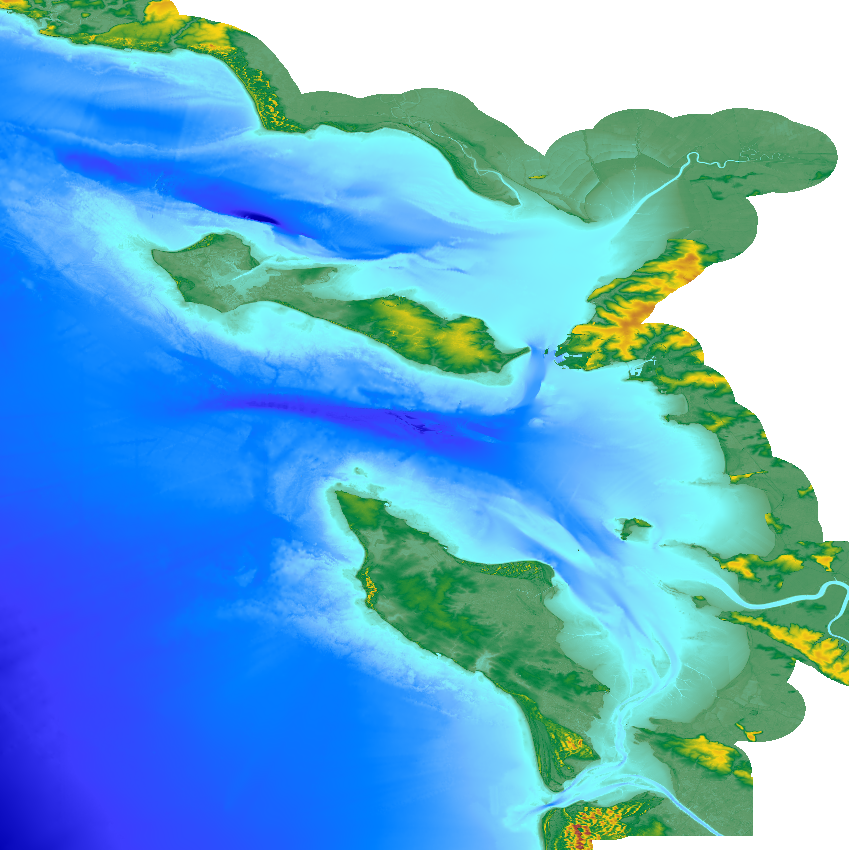
The update of the coastal topo-bathymetric DEM of the Pertuis charentais at a resolution of 0.0002° (~ 20 m) was carried out in the third phase of the HOMONIM project. The DEM extends from the terrestrial domain to about 60 meters depth over all the pertuis (pertuis Breton, pertuis d’Antioche and pertuis of Maumusson). The DEM is intended to be implemented in hydrodynamic models in order to produce forecasts as accurate as possible of water heights and sea states at the coast to improve the relevance of the Wave-Submergence Vigilance. This product is available with either the Lowest Astronomic Tide (LAT) or the Mean Sea Level (MSL) as a vertical reference.