 FormaTerre
2021
Type of resources
Available actions
Topics
INSPIRE themes
Keywords
Contact for the resource
Provided by
Years
Formats
Representation types
Update frequencies
status
Resolution
-

Velocity model described in the PhD thesis of N. Cuenot, used to calculate location of microseismic events of his second catalogue of the 2000 episode at Soultz-sous-Forêts. N. Cuenot used a local tomographic method to get more precise locations for his second catalogue as part of his PhD. The distributed velocity model is the input 1-D layered model required for the tomographic calculations. The second catalogue of events of the 2000 episode calculated by N. Cuenot using tomographic inversion is available (https://cdgp.u-strasbg.fr/geonetwork/srv/fre/catalog.search#/metadata/SSFS2000-Catalogue_Cuenot_2). Last update of data: 04/06/2021
-
Second catalogue calculated by N. Cuenot as part of his PhD thesis. The downhole network and the surface network were both used to locate events of the 2000 episode at Soultz-sous-Forêts. The catalogue contains 265 events with a magnitude superior to 1.3, with the parameters of the two nodal plans of the focal mechanism detemined using the FPFIT algorithm (Reasenberg and Oppenheimer, 1985)(not available if mechanism not well constrained). The catalogue covers only the stimulation test and not the post-injection test of the 2000 episode. The mean location error is assumed to be less than 50 m horizontally and about 80 m vertically. [see Chapters 6 and 7 and Annexe 1 of Cuenot's Thesis]. Seismic events of the catalogue were located using a tomographic inversion method (Thurber, 1983). The method allows a simultaneous inversion to retrieve both the seismic velocity parameters and the hypocentral parameters in a 3-D layered heterogeneous medium. The location takes into account the evolution of the velocity structure at each iteration. Time period: 30/06/2000 19:41:34 - 11/07/2000 01:14:49 (UTC). The data parameters are the following: Column 1: Event number Column 2: Date (UTC) Column 3: Time (UTC) Column 4: Easting from GPK1 wellhead * Column 5: Northing from GPK1 welhead * Column 6: Depth from GPK1 wellhead * Column 7: Latitude WGS84 ** Column 8: Longitude WGS84 ** Column 9: Elevation WGS84 ** Column 10: Magnitude determined from the seismic signal duration Column 11: Strike of the first nodal plan solution Column 12: Dip of the first nodal plan solution Column 13: Rake of the first nodal plan solution Column 14: Strike of the second nodal plan solution Column 15: Dip of the second nodal plan solution Column 16: Rake of the second nodal plan solution * The local coordinate system is based on the UTM32 system. ** Latitude, longitude and elevation have been derived from the local coordinate system. Remark: the signals from the Renass stations and the Güralp sensor of the surface network, and from the two hydrophones of the downhole network were not used to locate the events of the catalogue. The description of the surface network is available (https://cdgp.u-strasbg.fr/geonetwork/srv/fre/catalog.search#/metadata/SSFS2000-surface_network). The signals from the RéNaSS stations and the Güralp sensor of the surface network were not used to locate the events of the catalogue. The description of the downhole network is available (https://cdgp.u-strasbg.fr/geonetwork/srv/fre/catalog.search#/metadata/SSFS2000-downhole_network). the signals from the two hydrophones of the downhole network were not used to locate the events of the catalogue The associated velocity model is available (https://cdgp.u-strasbg.fr/geonetwork/srv/fre/catalog.search#/metadata/SSFS2000-Velocity_model_Cuenot_2). Last update of data: 04/06/2021;
-
Litto3D is a unique and continuous land-sea database which can provide 3D models of the shape and location of French coastal terrain. Litto3D digital models are available in two formats: a set of 3D points and a qualified terrain mesh.
-
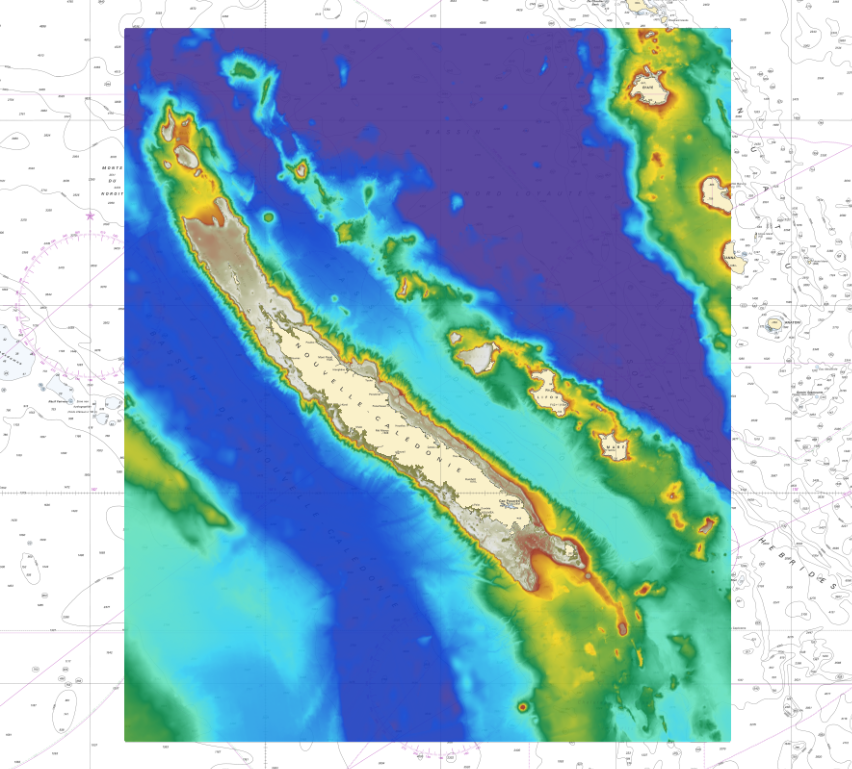
The bathymetric DEM for the coasts of New-Caledonia with a resolution of 0.001° (~ 100 m) was prepared in the framework of a Shom-IRD partnership as part of the TSUCAL project. The DEM covers the basin from New Caledonia in the west to the Vanuatu archipelago in the east. The DEM is designed to be used in hydrodynamic models in order to improve the pertinence of the Waves-Submersion monitoring programme.
-
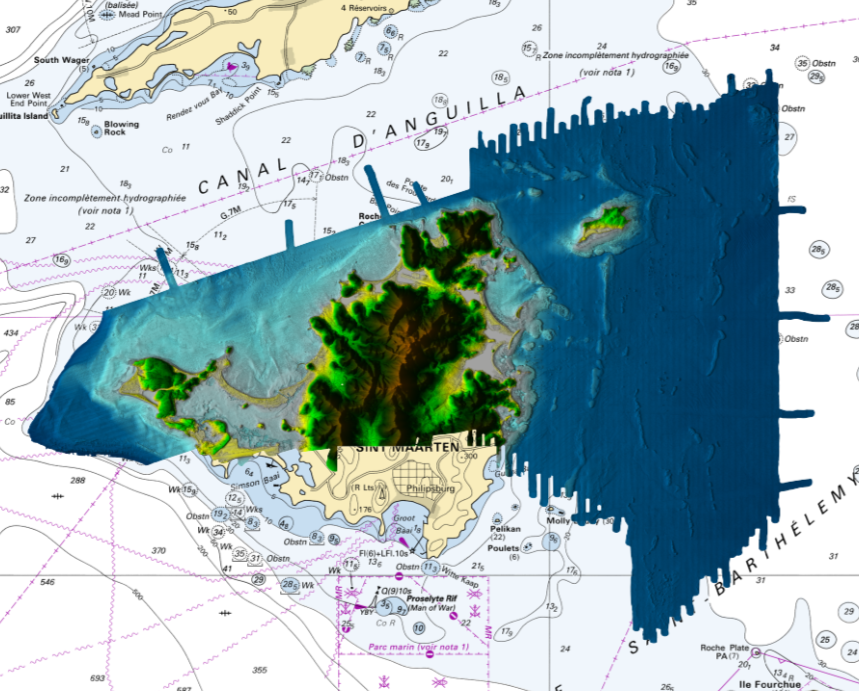
Litto3D is a unique and continuous land-sea database which can provide 3D models of the shape and location of French coastal terrain. Litto3D digital models are available in two formats: a set of 3D points and a qualified terrain mesh.
-
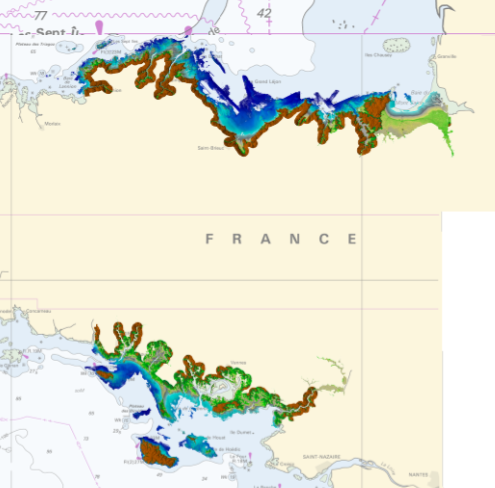
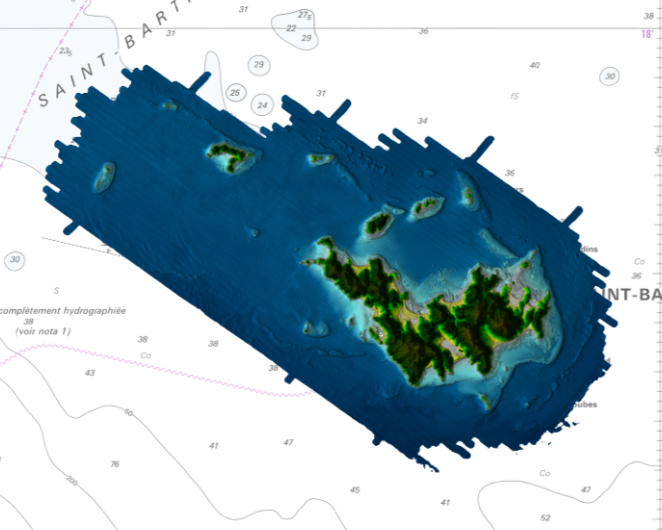
Litto3D® is a unique and continuous land-sea database which provide 3D models of french coastal areas. Surveys are carried out by airborne lidar bathymetry over the sea side and airborne lidar topography over the land up to 2km inland. Litto3D® digital models are available in two formats: a set of 3D points and a digital terrain model. The product "Litto3D® - Brittany 2018-2021" covers the coastline and islands of Côtes d'Armor, Ille-et-Vilaine and Morbihan departments.
-

Lidar marine part is a unique and continuous land-sea database which can provide 3D models of the shape and location of French coastal terrain. A line separates sea and land data acquisition zones, and the associated survey readings obtained using bathymetric lidar technologies or multibeam echosounders for sea readings and airborne lidar topographical surveys for land readings, with 300 m overlap. Litto3D digital models are available in two formats: a set of 3D points and a qualified terrain mesh.